We’re excited to announce some of the recent updates we’ve made to our user interface. These upgrades make our software not only easier to use, but also, well… prettier! Tl;dr: this phase of updates has focused on streamlining our navigation and making it more intuitive. We've consolidated all navigation into one single bar on the left side of the app – where there are seven different expandable sections. And we’ve moved all the admin tools into the upper right to make them easier to find no matter where you are in the platform.
Let's dive into all the powerful features that live within each section.
Overview
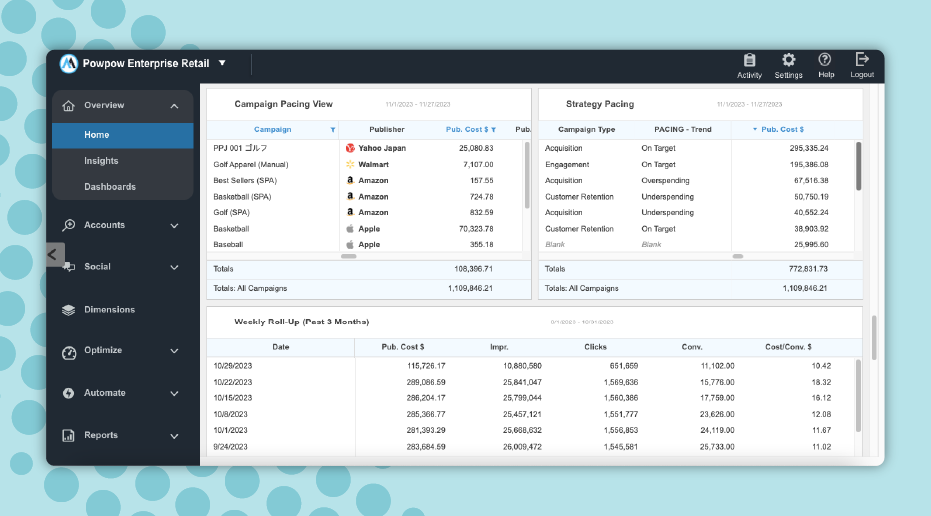
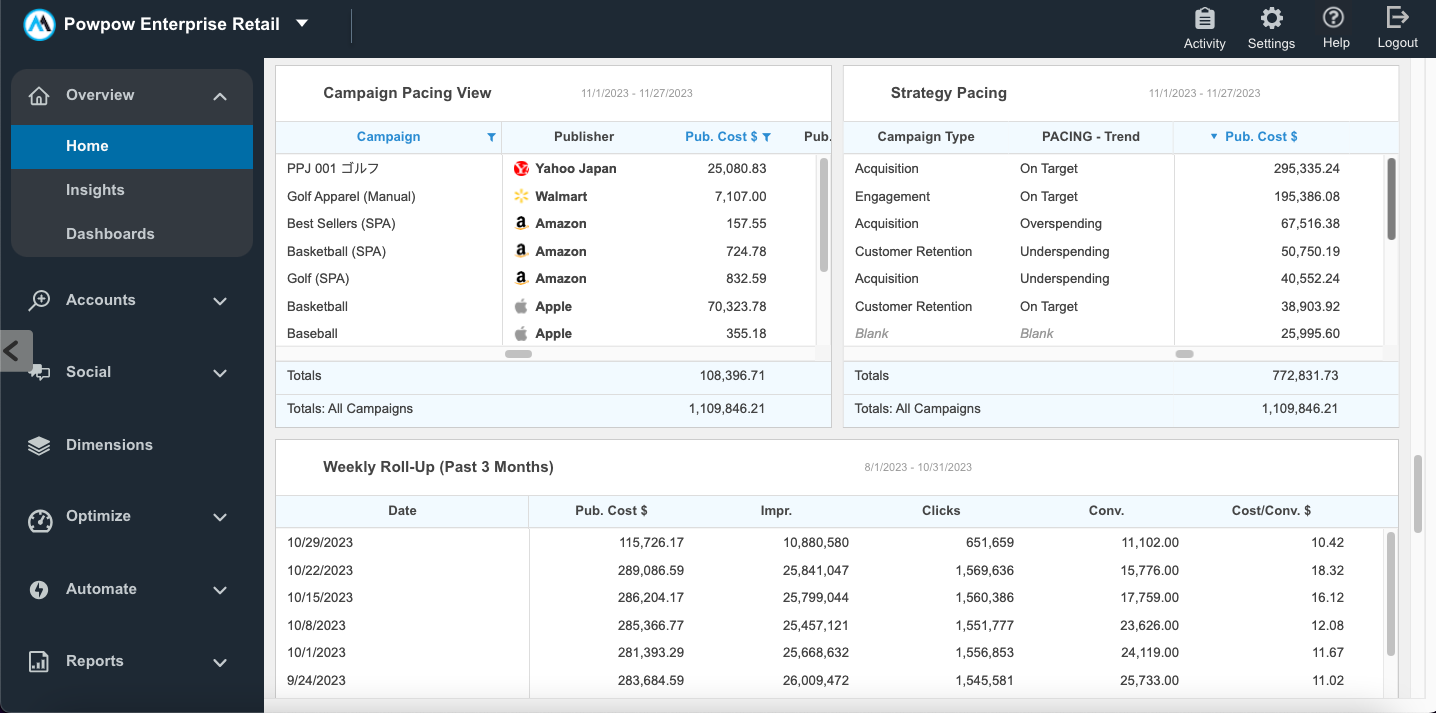
When you first visit Marin, you’ll be brought to the ‘Home’ sub-tab within the ‘Overview’ tab. Here, you’ll see a customizable dashboard full of charts and tables designed to give you a high-level overview of your performance. You’ll probably use this as your home base to provide a snapshot of which campaigns are doing well, which are doing poorly, and what needs your attention.
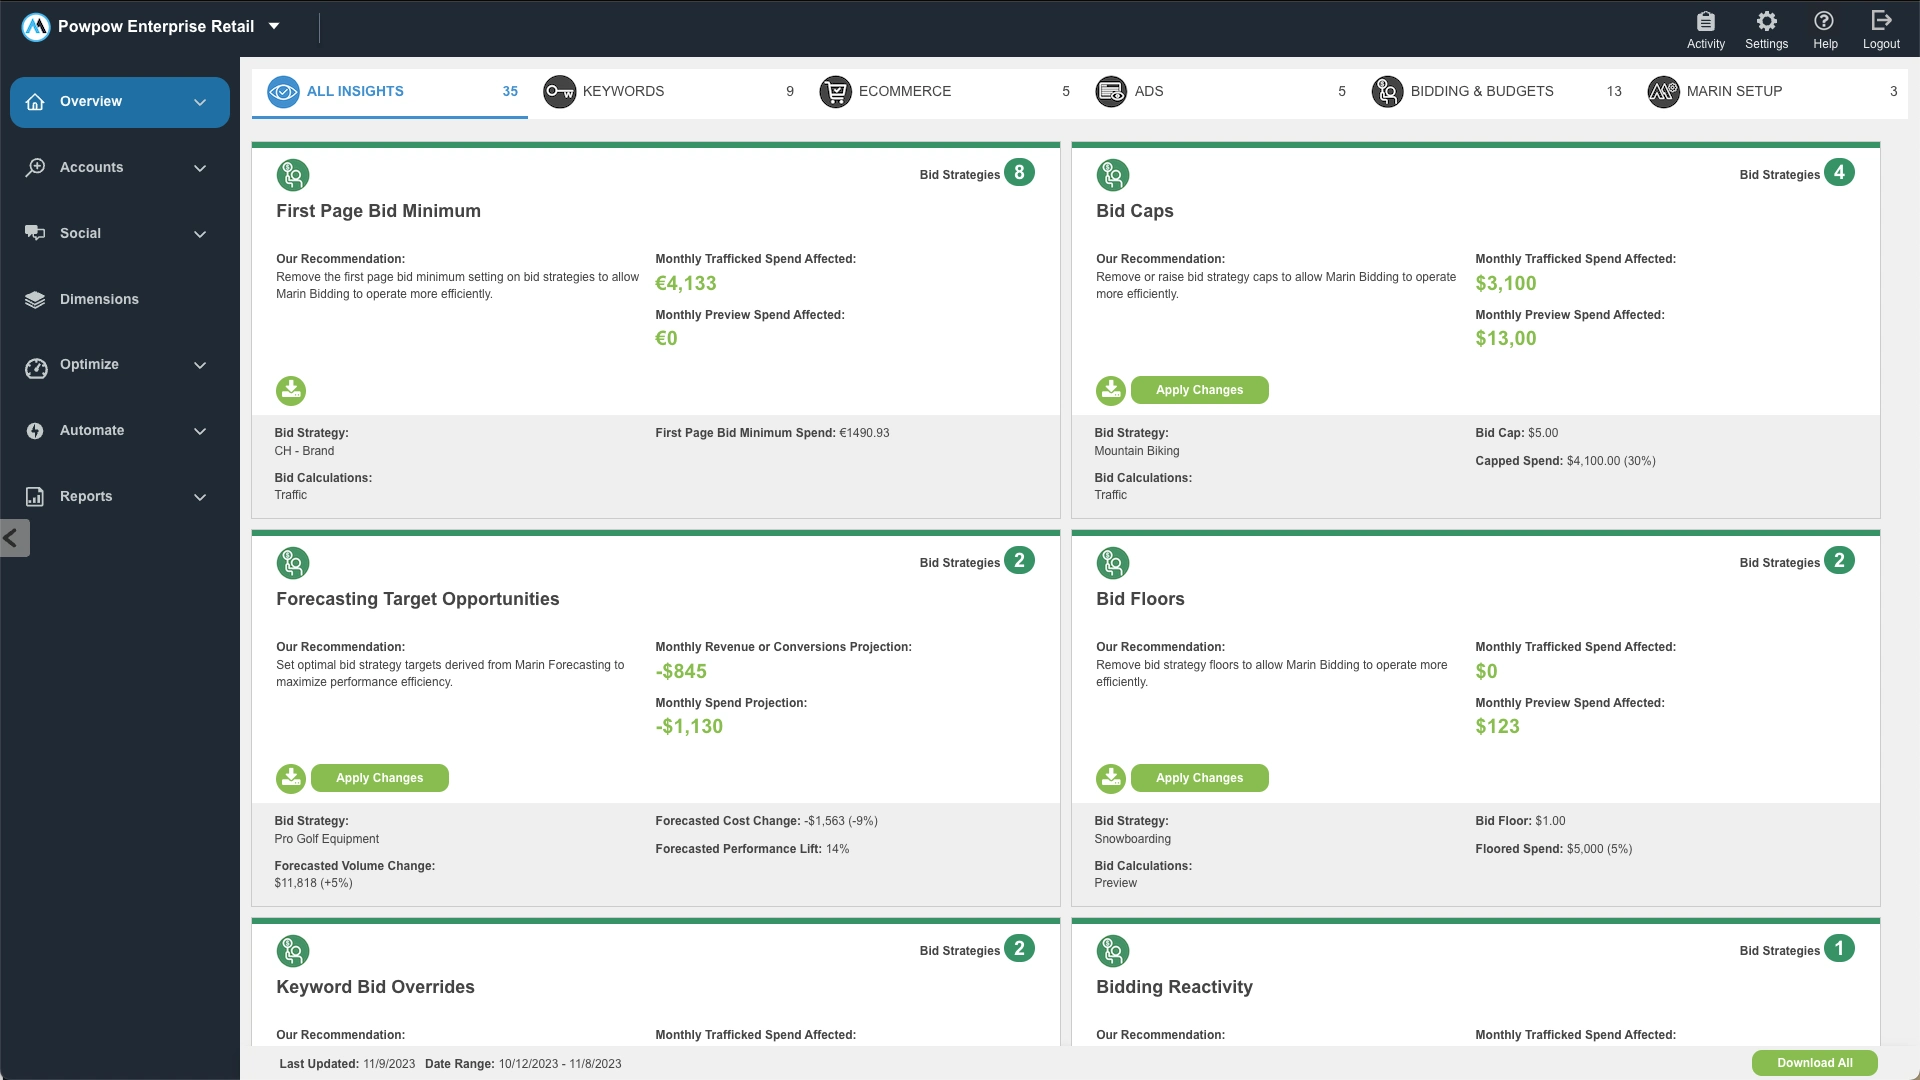
The second sub-tab in the ‘Overview’ section is Insights. Marin runs over 200 nightly checks on every account linked to the platform, identifying areas for improvement. Then, it provides easily implemented recommendations to improve performance – many of which you can apply with just one click.
The third sub-tab is ‘Dashboards’. This is where you can customize your home screen and create as many additional reporting dashboards as you’d like. Our dashboards are neat because you can interact with each individual chart and graph – changing date ranges, filters, and more. Additionally, links to your Dashboards are shareable to anyone, even those without Marin access. When someone without Marin access clicks a link to a Dashboard, it will take them to a read-only view of the report. This is great for real-time reporting on performance to leadership, or sharing marketing data with other teams.
Accounts
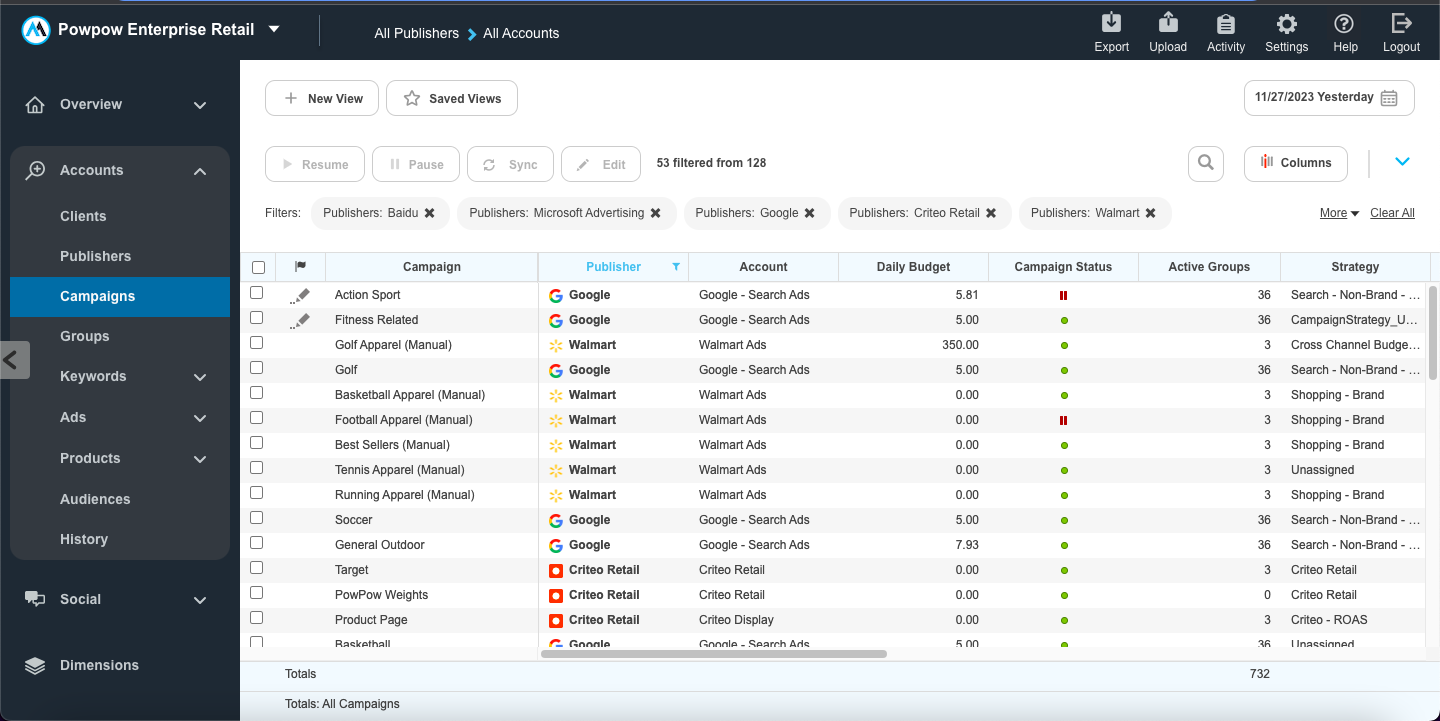
The Accounts section is where you’ll probably spend most of your time. Here, you’ll see a traditional waterfall view of all the different levels of a paid media campaign. This is where one of Marin’s most valuable features comes into play; consolidated reporting and optimization across publishers.
And our grids have been undergoing a bit of a makeover, too! Now, you can view and edit all the filters you’ve applied at the top of the grid. We’ve moved some other buttons around to make workflows more intuitive, too. For example, we’ve added a breadcrumb trail at the top of the grid that informs the exact path you took to get to the screen you’re currently on. You can toggle between different sections of the system using the breadcrumbs at the top or hover in the area around the breadcrumbs to open the Navigator to jump to critical parts of the system.
We’ve also made our charting feature collapsible and slicker. With our in-app charting, you can visualize your data with just a few clicks.
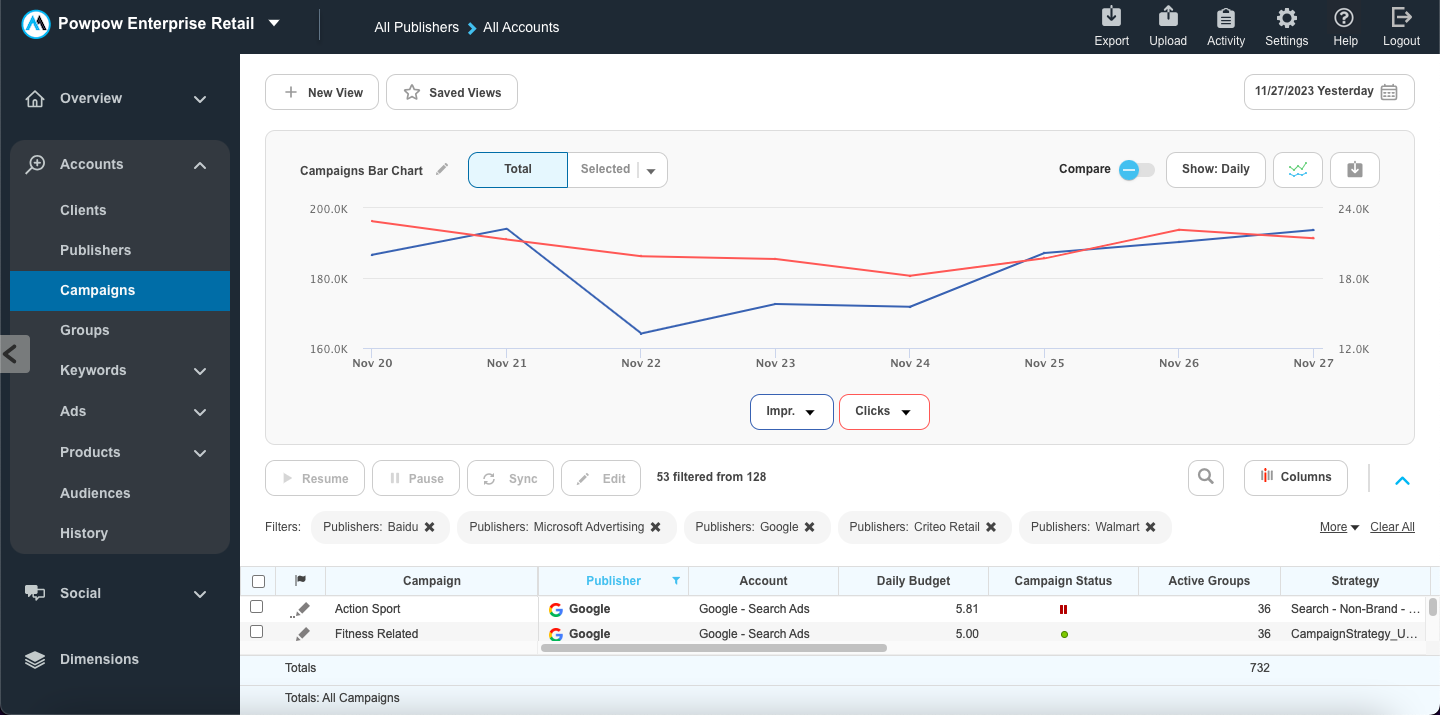
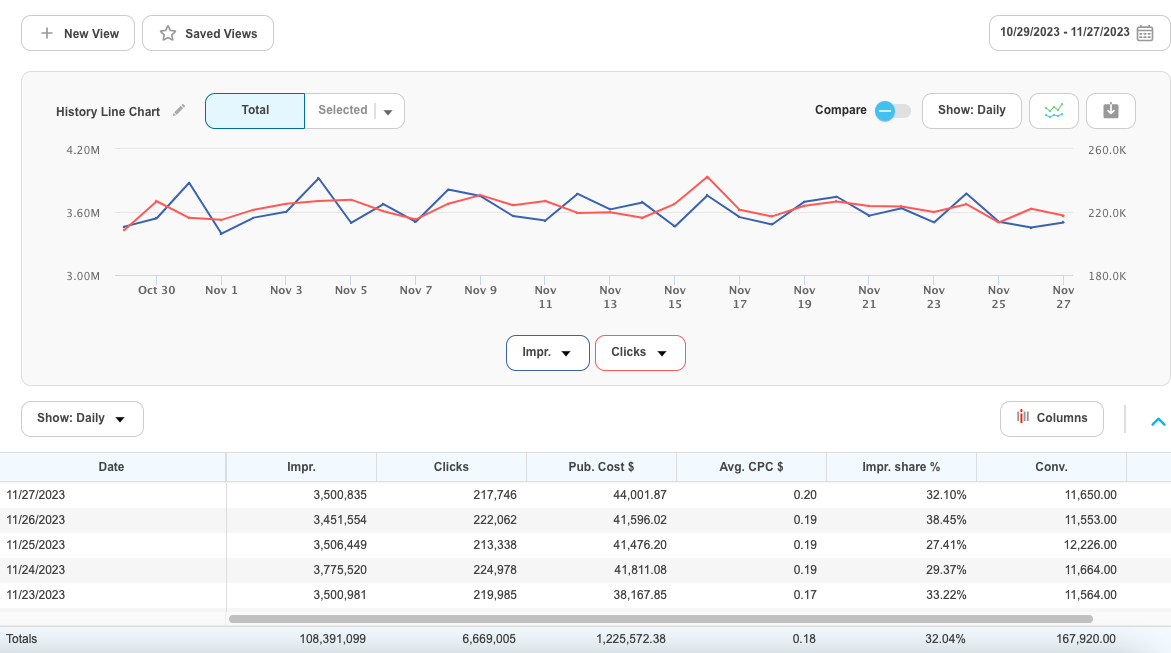
The one sub-tab here that you may not recognize from the traditional paid media waterfall (of campaigns>groups>keywords>ads, etc.) is the ‘History’ sub-tab. This tab gives you a high-level view of performance, rolled up by date. It’s great for understanding high-level trends in your campaigns' performance.
Social
Under Social, you’ll find all the Marin features that are exclusive to Meta. The two coolest ones are our Message Booster and Rules. Message Booster automatically turns your best performing organic posts into paid ads based on criteria you choose, like number of likes or comments.
And for those who are a bit dissatisfied with Meta’s bidding algorithms, Marin’s Rules allow you to choose your own criteria for automated bidding. This way, you’re able to use Marin’s intelligent bidding to automatically increase or decrease bids based on the KPIs that matter most to you.
Dimensions
Dimensions are Marin’s bespoke labeling solution. Some classic examples of dimension tags are campaign attributes like brand vs. non-brand, or geo location. In the dimensions tab, you can see data by dimension, and even pivot different dimensions against each other. This makes reporting on the categories that matter to you a breeze.
Optimize
Here is where you’ll find all of Marin’s (you guessed it…) optimization features. The first sub-tab is ‘Strategies’. This is where you can manage your cross-channel bid strategies and targets.
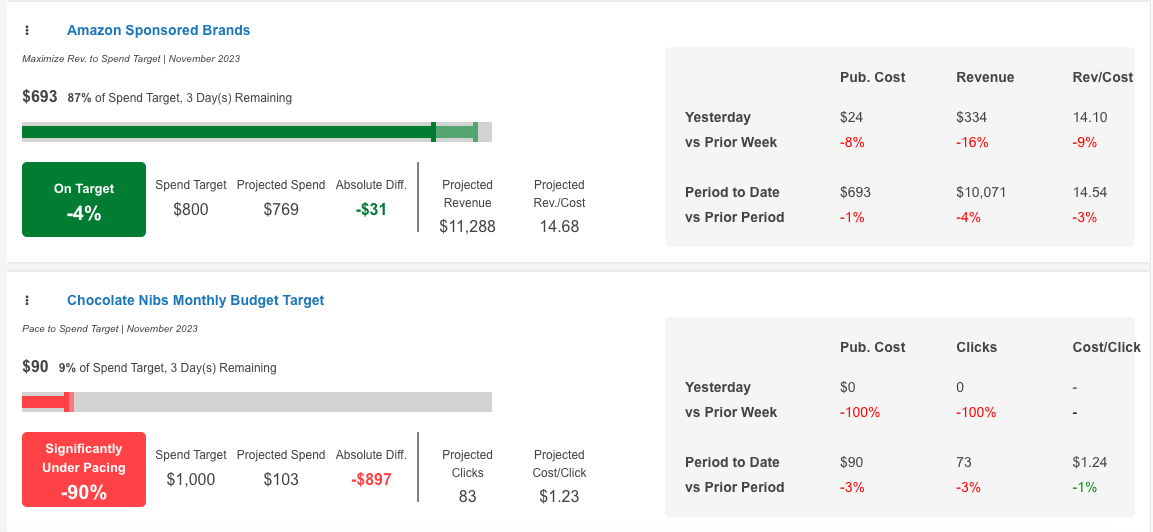
The second ‘Pacing’ sub-tab showcases our highly requested budget pacing feature, which allows you to segment campaigns into different spend categories and manage how each category is pacing toward its spend goal for the month or quarter. Marin can automatically update budgets, bids, and publisher bidding targets based on these pacing widgets as well.
Lastly, under Optimization you’ll see the ‘Dynamic Actions’ sub-tab, which enables clients that are using Marin bidding to layer custom rules on top of their algorithmically calculated bids.
Automate
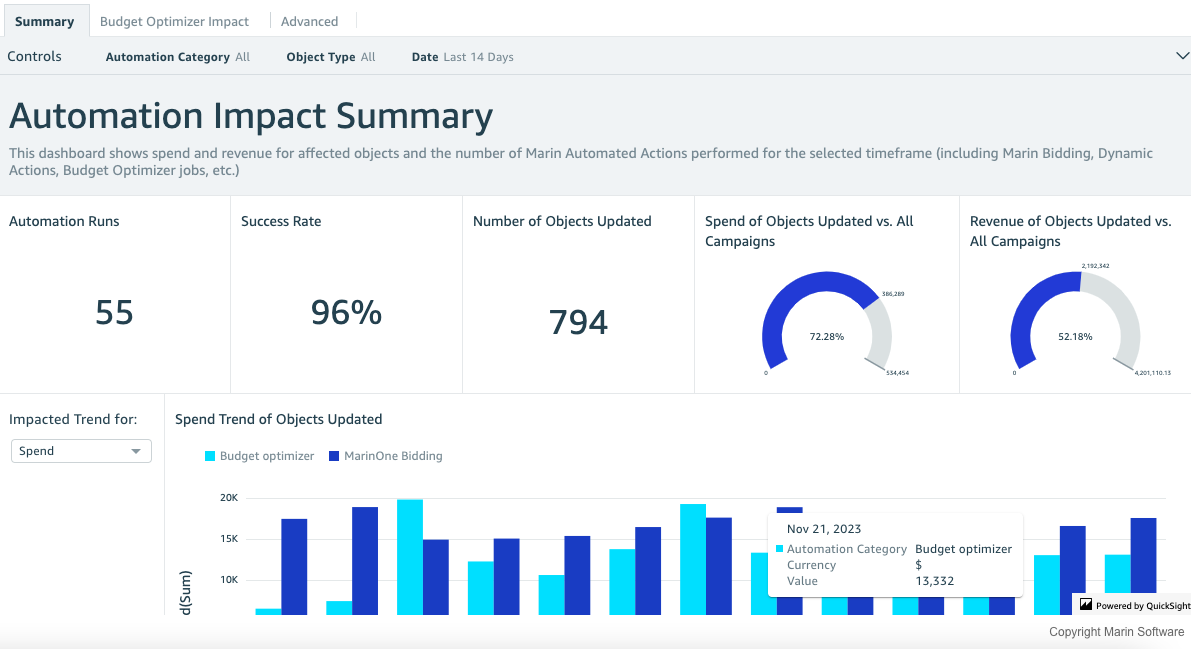
Under Automate, we first have the ‘Impact Summary’ sub-tab. This is a dashboard that showcases all the automated actions that Marin’s AI has taken on each object within your accounts. We understand that placing your marketing campaigns in the hands of AI can be scary. That’s why we built this dashboard – so you can understand all the automated changes being made, and have the power to override the automation if you want to.
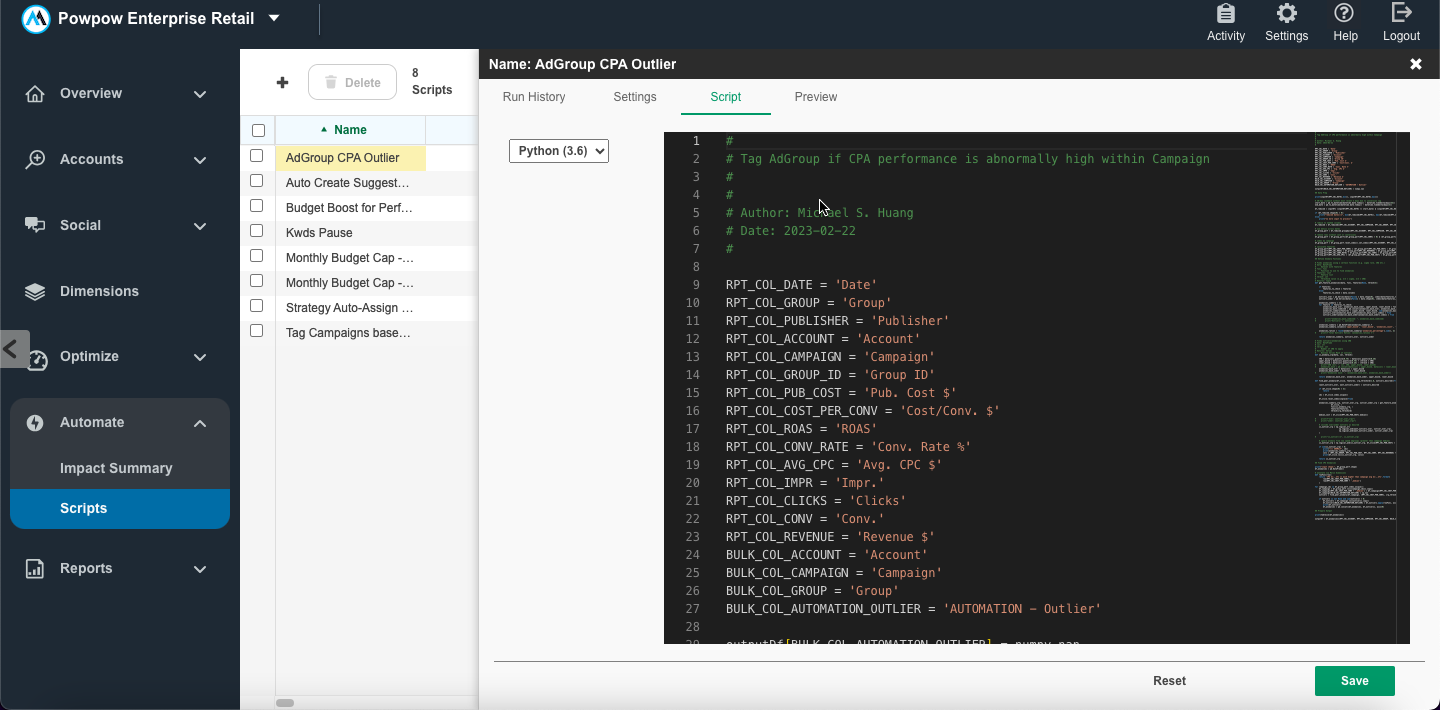
The other sub-tab under ‘Automate’ is ‘Scripts’. Our Scripts feature is new and we’re very excited about it! It enables clients to create their own custom automation with python code. From automating dimension labeling, to changing budgets based on custom rules, to increasing or decreasing CPA or ROAS targets based on backend data, the possibilities are endless. And with our ChatGPT integration, AI will write the code for you, and our Solutions Architects can help too. We certainly don’t expect you to learn to code in order to use Marin. Just let us know what you're trying to achieve and our support team will write and / or QA the code for you.
Reports
Under ‘Reports,’ you’ll find two sub-tabs, ‘Completed’ and ‘Scheduled’. This is pretty straightforward – completed reports can be downloaded from the ‘Completed’ sub-tab and scheduled reports can be edited in the ‘Scheduled’ sub-tab. But you’ll really appreciate the scheduled tab, because it allows you to edit any aspect of a recurring report. So no need to re-create a whole report because you’re missing one column or one filter. Never again – you’re too busy for that!
That brings us to the end of our tour of Marin’s new UI. But stay tuned, because there are many more updates coming out next quarter that we can’t wait to share with you! And if you’re considering Marin and want to learn more, click here to schedule a demo of our gorgeous new UI.